
Observability is a list of questions, not a wall of dashboards
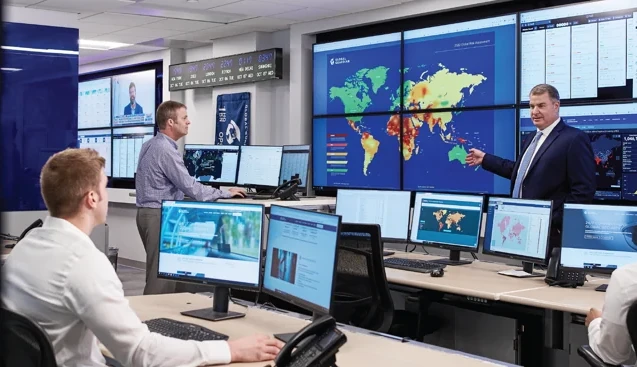
Walk into any operations center and you will see them: walls of dashboards, dense with charts, most of them green, few of them ever read. Observability programs tend to be judged by what they display. We would suggest a different measure: what they can answer, under pressure, at 2 a.m., for someone who did not build the system.
The distinction matters because incidents are interrogations. A payment partner calls: their transactions are failing. The questions arrive in a predictable order. Since when? Only them, or everyone? What changed? Who else is affected and doesn't know yet? A wall of charts answers none of these directly; it offers raw material for an expert to interpret, if the expert is awake and remembers where to look.
Why dashboards multiply
It is worth understanding why the wall grows in the first place, because the mechanism is almost gravitational. Every incident that catches a team off guard ends with a resolution to "add monitoring for that," and so a new chart is born. Nobody ever removes one, because nobody can be sure it will not be needed. Over a few years this produces a display dense with panels, each of which answered one past question and none of which was designed to answer the next one.
The result is a paradox: more visibility and less insight. The signal that matters during an incident is buried among a hundred that do not, and finding it depends on an expert who already knows which panel to trust. That is a fragile foundation. It means your ability to understand an incident rests on who happens to be awake, rather than on the system itself.
Start from the questions
The most effective estates we see have done something almost embarrassingly simple: they wrote down the questions the business asks during incidents and reviews, and worked backwards to the telemetry each one requires.
- Which consumers are affected by this degradation, by name, not by IP range?
- Is this failure ours, or a third party's, and which contract does that invoke?
- What did this exact transaction experience, end to end, across every hop?
- Are we currently meeting the service levels we sold, per consumer, per tier?
Notice that every question is phrased in business terms: consumers, contracts, transactions, commitments. Telemetry that cannot be joined to identity, the who behind the traffic, can describe symptoms but never impact. This is why observability belongs at the gateway, where every request already carries its consumer, its product, and its policy context.
Fewer charts, faster answers
The practical consequence is counterintuitive: mature estates often display less. A handful of views tied to the written questions, and underneath, traces and records rich enough to answer the follow-ups. On Waygrid, every interaction is recorded with its full context by default, so the answer to "what happened to this partner's transaction on Tuesday" is a query, not a war room.
The shift is from watching to asking. A wall of dashboards is built for continuous watching, an activity that scales badly and fails exactly when attention is scarcest. An answerable estate is built for asking, so that the question raised at 2 a.m. by someone who did not design the system still has an answer. The dashboards stay green either way. The difference appears the moment someone asks a question the wall was never designed for, which is to say, during every incident that matters.